This WordPress tool from the team behind Food Blogger Pro and Pinch of Yum promises a seamless analytics experience and project management all in one. But is Clariti the ultimate blogging companion it claims to be? We’ve put it to the test on our own blog and here’s how it went.

Table of contents
What is Clariti?
“Clariti is the content organisation system for bloggers that syncs your WordPress and Google data so you can stop the manual work and start seeing data-driven growth.”
Clariti.com
Clariti is an organisation and optimisation tool developed by Tinybit – the team behind Food Blogger Pro, WP Tasty and Pinch of Yum.
It’s goal is to replace tedious research and manual spreadsheet tracking with a comprehensive all-in-one system. You can use it to review and analyse your blog posts and project manage common blogging tasks.
Link it to your Google Analytics, Google Search Console and your Wordpress website and it will bring together everything you need to know in one place, such as page views and sessions, keyword positions and top traffic sources. You can easily see stats like time on page and % change, which have become a little more laborious for bloggers to access using GA4.
Previously we’d have to flick between multiple browsers to get a complete overview of one recipe. Now everything we need is in one place with easy-to-see graphs and metrics at our fingertips.
With Clariti you can also setup and manage blogging projects and to-do lists on a post-by-post basis. It’s perfect for tracking post update tasks or running quick projects to fix broken links, broken images, or missing alt text to optimise your site.
So! Now that you know what it is…
Who’s It For?
Anyone with a website focused on producing helpful and meaningful content can use Clariti. However, the creators say you’ll get the most out of it if your site has with a minimum of 200 posts.
(Of course, you can still use it if your site is smaller, but will need to consider if the ROI is right for you.)
Clariti is super useful if you want the ability to EASILY dig into the nitty gritty of how your blog posts are performing. Sure, you can access this data in your Analytics and Search Console accounts already. And you can use one of a range of task managing systems out there. But Clariti is the only tool we’ve come across that combines the essential elements of all of these abilities in one place.
5 Reasons We LOVE it!
GA4 has a steep learning curve and is quite confusing for most bloggers out there, especially after the streamlined system that was the previous Universal Analytics interface. But with Clariti, you can see all of the essential data on a quick overview tab called “Explore” or on an individual post basis.
This ability has been a HUGE TIME SAVER for us and is what we love most about this system. We now use Clariti for our weekly review of new and updated posts, and will hop on almost daily to check various posts as part of our regular blog work.
1. Using the Explore Tab for a Quick Post Overview
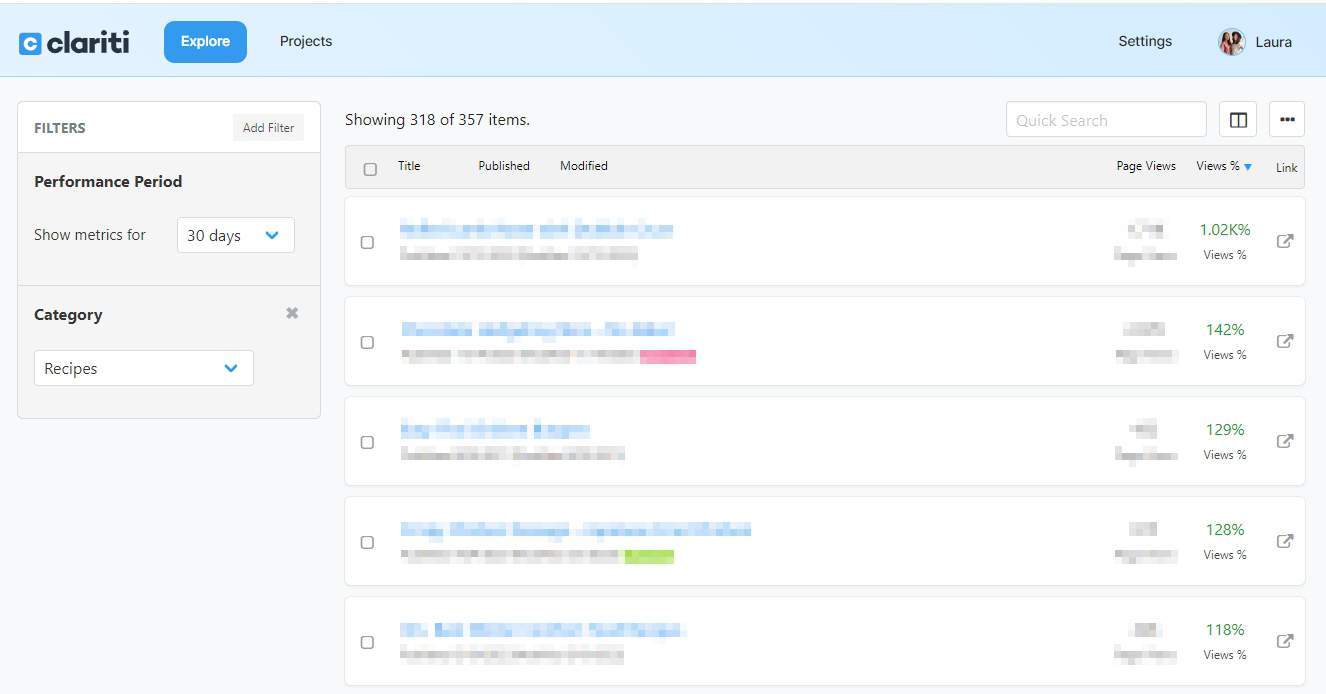
For a quick, high level snapshot of all your latest posts, head to the Explore page. Here you’ll see a list of your latest blog posts with some specific column metrics preloaded to display. You can change these simply by clicking a button and ticking / unticking various options.
We usually have ours set to display Page Views and Views % (ie increase or decrease over last 30 days), as we find these to be the most useful at a glance.
Note: Views % is a particularly helpful column as we aren’t able to sort by weighted or absolute change in GA4 like we used to back in Universal Analytics, and we really missed it!
Some other useful columns you could turn on are Alt Text Missing, Broken Links, Inbound Links etc depending on what you want to check or optimise. We’ve used all of these at various times to fix issues and add more internal links when necessary for a post. Just click the column icon next to the Quick Search box and select the extra columns you want to add.
You can then sort your list by any of these columns, for example Views % to see which posts have had a significant increase or decrease (like in the screenshot below). This is super handy in the lead up to key holidays or to see trends for your seasonal content.
The filters panel on the left hand side is also a great way to dig deeper into a specific subset of posts. We often filter by category to focus on specific posts, but there’s lots you can do here depending on your focus.
2. Labelling Posts for Easy Identification
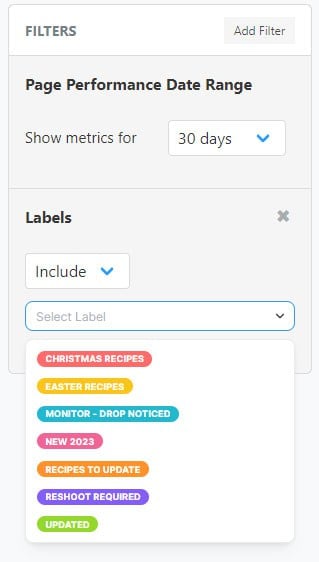
Clariti offers the ability to label your posts with custom colour-coded labels. (If you’ve ever used a Mac, it reminds us of the colour coding system you can set up on your folders).
However, it doesn’t come with any pre-loaded examples, so, you’re free to use this feature however you like. We got started by creating a few labels to track post updates including: ‘New post’, ‘Recipes to update’ and ‘Reshoot Required’. Since then we’ve created labels for seasonal posts that don’t otherwise fit into a specific category. That way you can use the Explore tab filters to view and analyse this subgroup of posts.
It’s super handy to see these eye-catching labels on the Explore tab, and it’s a great way to easily pull up a list of your recently updated posts and see how they’re tracking over time.
3. Single Post Pages – Overview Tab
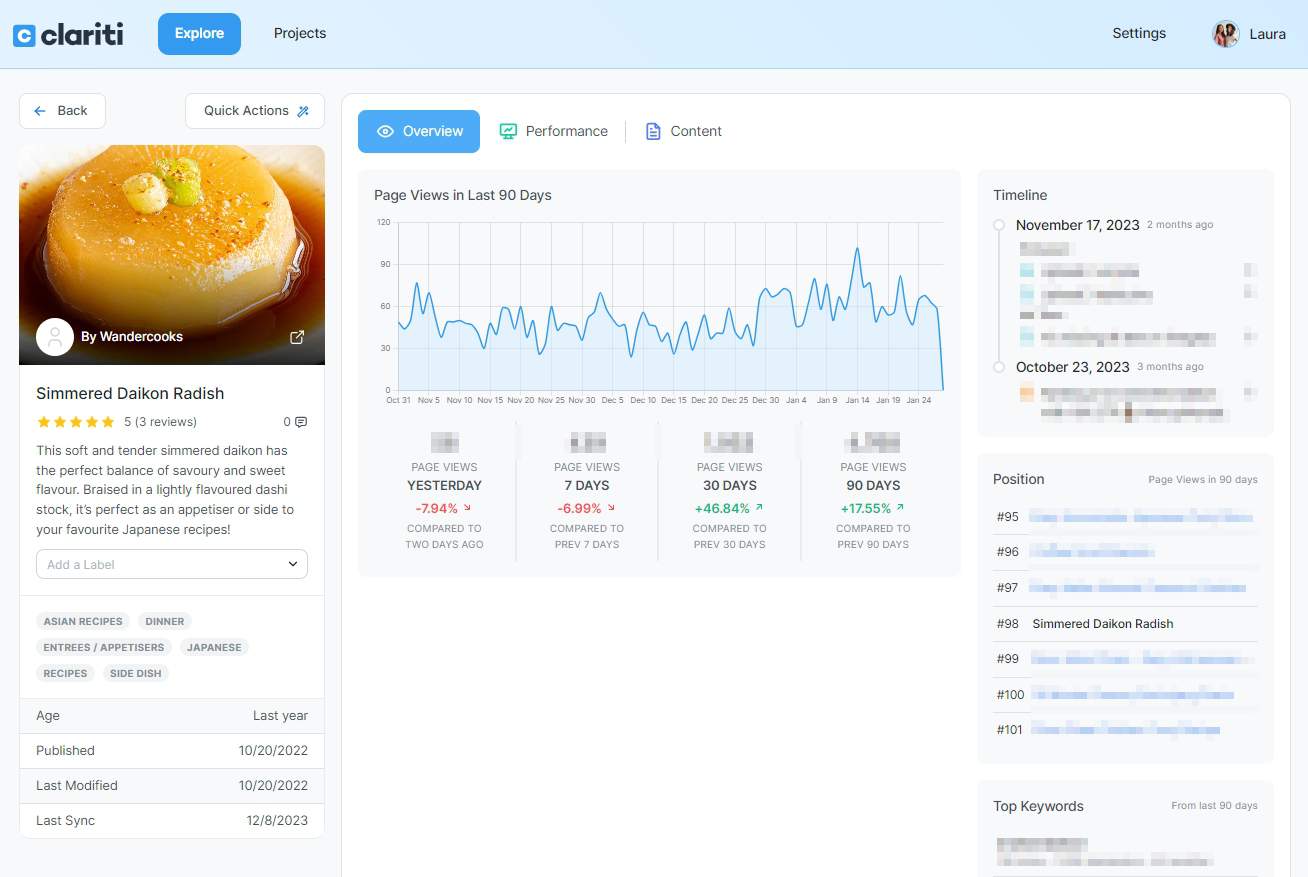
The Overview tab is just a good quick look at how your post has been tracking the last 30 days. One thing to note, is the pageviews compared to Yesterday comparison will currently always be down and in the read. This is because GA4’s reporting is delayed, so your post will essentially show little to no views from the last 24 hours.
We basically just use this page for a quick check to see how the graph is looking or if there’s any open projects on the post that are waiting to be completed.
4. Single Post Pages – Performance Tab (Our Favourite Page in Clariti)
This is where the magic happens. This is why you want to use Clariti!
We love numbers, but even more – we love graphs! They’re the quickest and easiest way to see how a post is performing over time. GA4 has made it harder to see a graph for just one individual post at a time, so having this built right into Clariti on individual post’s pages is a GODSEND.
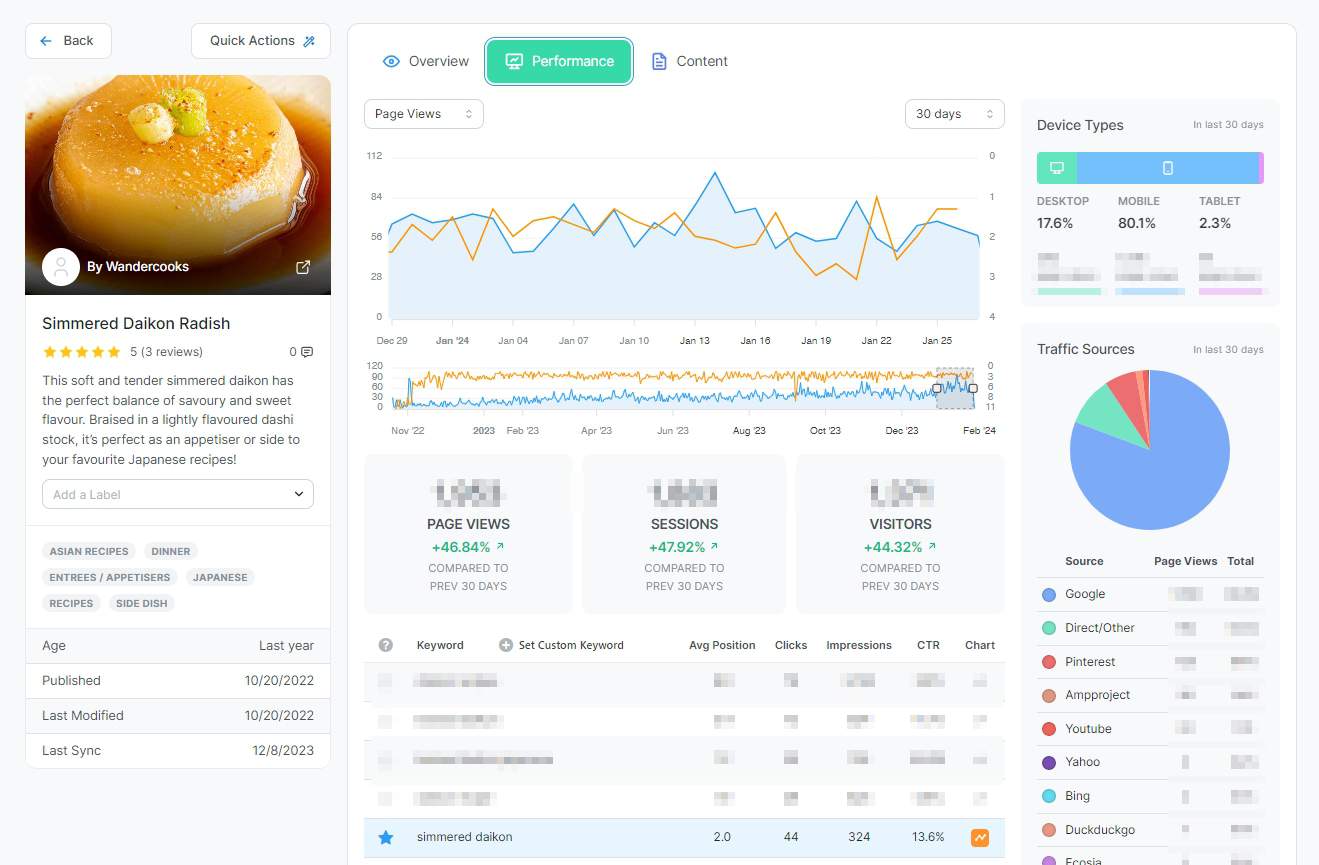
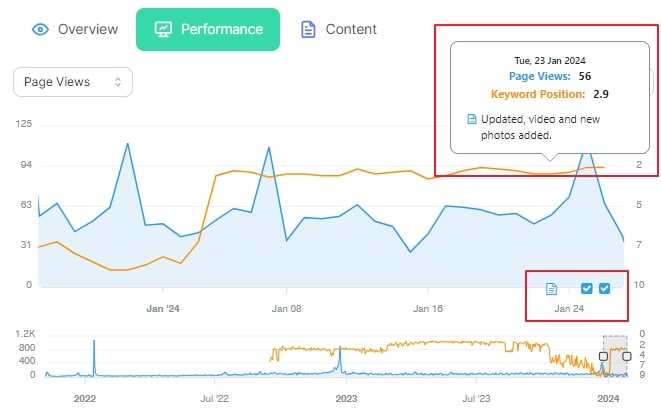
Click into the Performance tab of a specific post page and you’ll see a graph displaying sessions over time. But once you select a keyword below the graph, it will overlay the keyword position data from GSC! This is total magic for your keyword research tracking.
It essentially feels like having the old Google Analytics graphs with the GSC graphs laid over each other, all in one place, for a specific post.
Boom.
And if for some reason your post isn’t ranking for your intended keyword at all (i.e. you can’t see it in the list of keywords below the graph) you can set a custom focus keyword for that post. This is especially good if you’ve updated a post with an altered keyword intent.
That right there is a massive timesaver for us!
You can currently set the date range to be for the last 7 days, 30 days, 6 months, 1 year or 2 years (although with GA4 showing only 14 months, and GSC only 16 months, this last one is a little redundant).
You can also use a slider to zoom in on a specific period for a closer look.
The Traffic Sources graph is another handy feature that, sure, you can get elsewhere in Google Analytics etc, but boy oh boy does it take a lot more clicks!
Head to an individual post’s performance tab and you’ll see a handy pie chart on the right hand side. This is where you’ll see your top traffic sources for that post for the last 30 days. This is super handy to see at a glance, especially when you get a traffic spike and want to identify where it came from. It even still shows your Web Stories traffic (Ampproject).
5. Single Post Pages – Quick Actions – Events
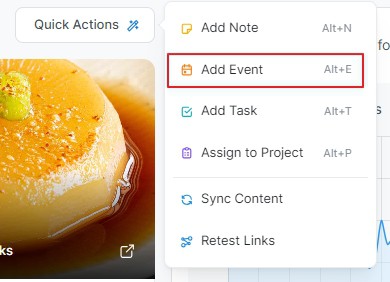
When updating posts, we love having the ability to pin a note to the graph as an ‘Event’ (formally called ‘Annotations’). That way later down the track, you can easily see the point when a post was updated and its performance since then.
This is another well-loved feature that was dropped from GA4, which may or may not be returned in a later version at Google’s whim.
Having Event annotations on the graph in Clariti allows you to quickly get the info you need at a simple glance. Absolute win in our books. Below you can see we recently updated a post that saw a large keyword drop from the Google Core Update in Oct 23. It had since recovered, but we still updated the post by reshooting the recipe and adding a video. You can see we’ve now marked this on the graph for future reference.
What are Clariti Projects?
Along with the analytics side of things, Clariti also comes with a task managing system called Projects. To be honest, we don’t use this side of Clariti as much as we do the Explore tab, because we already have an established workflow using Todoist, which we use for blog and for personal tasks.
However, the two example projects they recommend for Missing Alt Text fields and Broken Links have been super helpful. We run these on a regular basis just to check and optimise as we go.
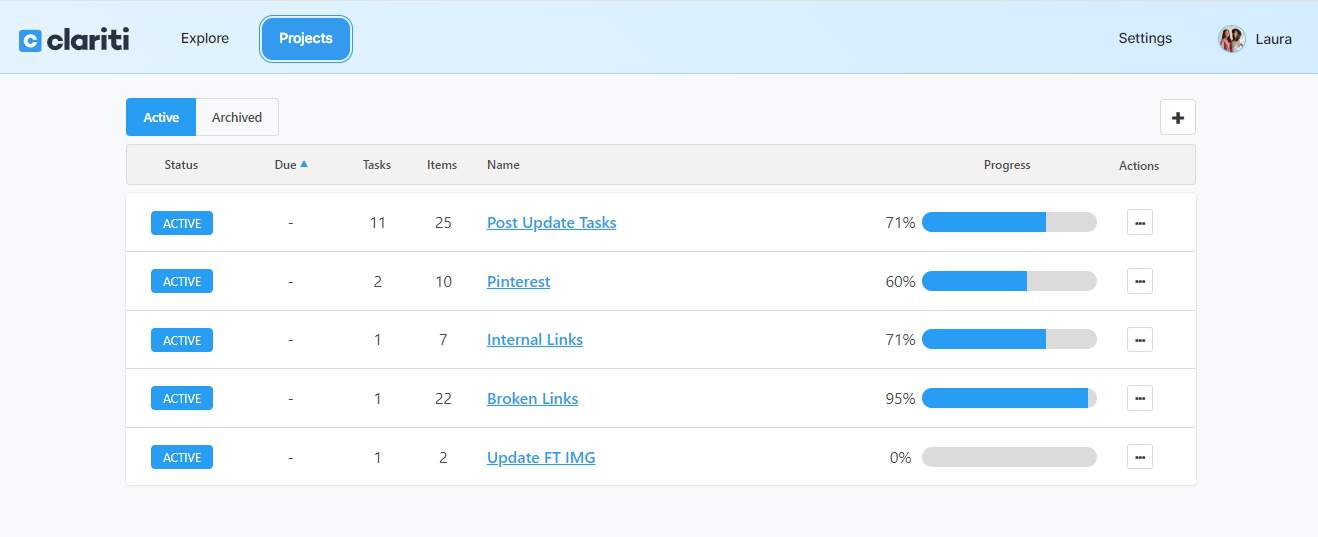
You can create a Clariti project to track pretty much anything you like, each with its own list of subtasks. Then you can apply that project to any number of posts. Projects appear on the main Projects tab, where you can click to see all posts assigned to that project, and see their progress with a progress bar. They’ll also appear on the Overview section of an individual post, where you can tick the checkboxes as you complete each task.
We’ve experimented with a few of our own custom projects and related sub tasks. Here’s some ideas to kickstart your own:
- Post Update Tasks – A checklist of everything we need to complete and do when updating a post.
- Pinterest Tasks – Making sure we’ve created the right amount of regular + video pins for each post.
- Internal Links Updates – Checking if all posts either have enough internal links or require more.
- Feature Image Updates – A quick update for any post we find is getting lost on Google and not receiving the average CTR for it’s positioning.
Clariti Support
One thing we’ve loved so far with Clariti is the quick and helpful support we’ve received so far. The support team have already helped us with a tricky glitch on sign up and a couple of small issues along the way. Each time we’ve reached out the have responded quickly and kept us updated every step of the way. They get full marks from us on this!👌🏼
Final Thoughts
As you can probably tell by now, we love how with Clariti, you can see so much data all in one place for a specific blog post. But even more than that? We love how QUICKLY it does it. Going into and out of blog post data, or searching for a specific post, loads like a dream.
Unlike the bogged down feeling of GA4, Clariti just feels very intuitive. The TinyBit team know what bloggers really need to focus on and have made it all so quick and easy to access. It’s like a breath of fresh air after GA4, honestly.
There’s so much built in flexibility and with projects, filters and labelling, you can really can make it your own.
Like all blogging tools (or everything, really) you’ll get out what you put in. So take the time to learn the system, set yourself up properly with effective projects, and put all of this time saving into reviewing your data and making informed decisions for your blog!
Armed with Clariti, a solid keyword research system and a sound understanding of analytics and you’ll be ready to take your blog to the next level.
Got questions on how we use Clariti? Drop them in the comments below.
Learn more about food blogging here:

No Comments