Discover the must-have GA4 features every food blogger should know, including a secret method to access individual post analytics. Master the art of utilizing GA4 for your food blog’s data analysis.
In This Post You’ll Learn
- 1. Everything is now an Event.
- 2. Here’s where to find your traffic by source / medium in GA4.
- Unscramble Your Stats – Learn GA4 for Food Bloggers Ebook Course
- 3. Single Post Graph Analytics
- 4. Customise Your GA4 Mobile Dashboard
- 5. Custom Reports are Essential! (And for some reason called Explore in GA4)
I want you to think of GA4 like a flat pack from IKEA vs Universal Analytics as a nice Tasmanian Oak dining table.
GA4 is a lot to get your head around in the beginning, but once you’ve set it up correctly AND understand where everything is, it does make more sense.
I can tell you it took me 3 intensive months to learn the ins and outs from scratch before we launched Unscramble Your Stats. I still don’t like it, but at least I a) understand it and b) can use it.
I went into GA4 with one fundamental question – where was this in Universal Analytics?
The simplest answer was – it IS still all there in GA4 for 95% of what we could get in Universal Analytics.
You just have to literally set EVERYTHING up yourself, or dig into 2-3 times more layers to get the data you could originally get in one click. While it’s infuriating from a user perspective, everyone’s hands are tied, so just rest easy knowing you can still access all the data you need.
Now after using GA4 for the last year, here’s 5 features we’ve found super useful to get you started in mastering GA4 for your food blog.
1. Everything is now an Event.
Want to look up Page views? It’s an Event.
Session count? An Event.
Users? An Event.
This is the way GA4 tracks users, which means each action taken by a user on your site is then labelled as a different event, such as a click, scroll or pageview.
Here’s a quick GA4 Event Labels terminology cheat sheet to get you started:
• page_view / Views – Known as Pageviews in Universal Analytics.
• session_start / Sessions – Known as Sessions in Universal Analytics.
• users – Known as Users in Universal Analytics.
• first_visit – The first time a user logs onto your blog.
• user_engagement – When a user has your blog up at the forefront of their screen for at least 1 second. Universal Analytics wasn’t smart enough to know this, so your user timing and engagement will be much smarter in GA4. Now, if someone has your blog open in another tab or minimised, it will no longer count as active time on your site.
• click – If a user makes an action and clicks on something which takes them away from your blog. This applies to external links only, not internal clicks to your posts or recipes.
• scroll – If a user scrolls down 90% of your page, this will be triggered. Don’t be surprised if your scroll counts are super low for your site. For this to trigger on a food blog, readers would have to scroll past the recipe card, pretty much down to the comments for this to count!
To find all these Event stats in GA4 head to:
Reports – Life cycle – Engagement – Events
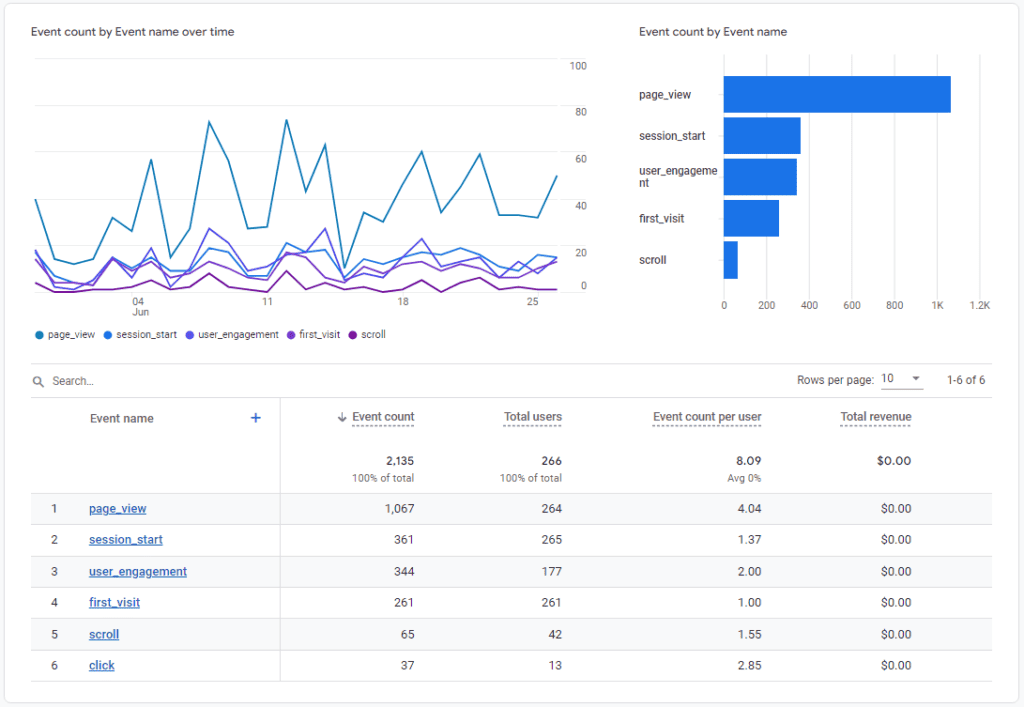
Here you can check all your favourite numbers for your traffic as usual. You can also click into a particular event, such as “Page views” to see more information such as top pages or event count per country.
Quick Action Tip – Discover Your Blog’s User Engagement
While this type of data can usually be described as vanity metrics (just checking your pageviews to give yourself a dopamine boost) – there is one handy thing you can learn from this page – User Engagement!
Find out how interested your readers are by looking at the difference in numbers between your sessions and pageviews.
In the example above you can see there’s almost 3x the amount of pageviews vs sessions (1067 / 361 = 2.95). This means for each session, the reader is reading an average of almost 3 pages! The higher the number, the more engaged your readers are with your content and brand as a whole.
2. Here’s where to find your traffic by source / medium in GA4.
This is an easy feature to find and one of our most asked questions so far – how do I see the source / medium for my traffic in GA4?
All you need to do is go to:
Acquisition – Traffic Acquisition
Now click on “Session default channel group” and select “Session source / medium” from the drop down menu. You can now see your traffic sources divided by your usual referrers such as Google, Pinterest etc.
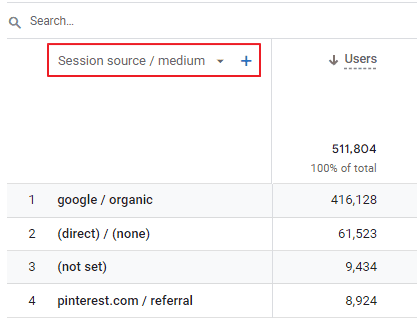
Keep this in mind as you discover the reports in GA4. Often the answers or data you need are hiding behind a drop down menu or filter!

Unscramble Your Stats – Learn GA4 for Food Bloggers Ebook Course
“Unscramble Your Stats” is a wonderful and useful read not only for food bloggers but for any blogger who wants to understand how to use Google Analytics (both Universal Analytics and GA4).”
– Alan K’necht, founder of K’nechtology Inc.
Harness your analytics and make informed decisions to improve your traffic and reader experience. Learn everything you need to know about Universal Analytics and GA4 tailored specifically for food blogs!
3. Single Post Graph Analytics
One of the most frustrating changes in GA4 for us is the inability to click into a single post and see the graph stats for only that post. It can be done, but there’s just a few more steps to get there. Sigh.
Here’s how to do it:
Head to Reports – Life cycle – Engagement – Pages and Screens
If you like to monitor how your posts are going – especially new or updated posts – you’ll find yourself on this report a lot. The problem is when you want to narrow down the information.
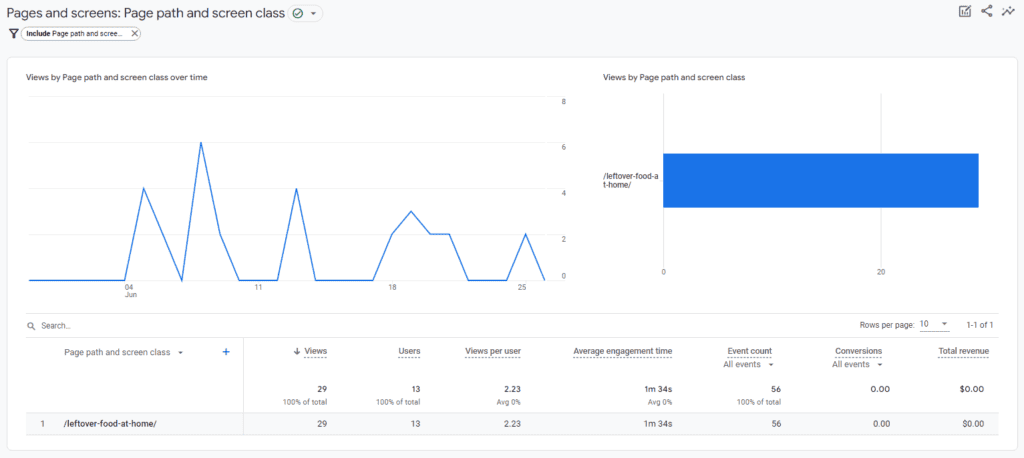
In the example we want to look at the stats for the page “Leftover food at home”. We could type in the search box “leftover” to bring up the stats such as views, users etc, but the graph at the top of the page won’t change – it’ll still show the graph lines for your top 4 pages.
This is a problem! If you can’t see the graph, you can’t see the trends. You only see a final number, not a breakdown of page views per day.
So here’s how to get the right information:
Under the title “Pages and Screens…” at the top of the report, you want to click on the button “Add Filter +” underneath. This will bring up a menu on the right hand side.
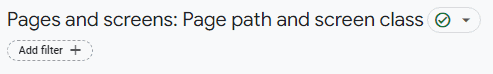
Leave as Include – Dimension then type “Page” into the box below and select the option “Page path and screen class”
A new box for Dimension Values will appear. Start typing a word from the URL you want to select, in our case “leftover”, until you see the URL pop up. Select that and hit Ok.
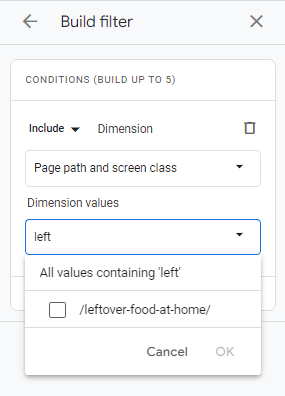
Now click the blue Apply button at the bottom of the menu.
Now you should see the graph results for ONLY that post. You can now change the dates or compare dates and start analysing that data!
Why is it so important to see a single post graph?
Seeing a graph instead of a number is SO. MUCH. MORE. USEFUL. A number can tell us a little bit (oh I got more views than last month), but it’s not telling us the whole story, and this is where using your data smarter can help you build traffic by understanding the readers you already have.
Here’s a couple of ways we use it:
- Trends – Seeing the graph over a certain period of time, lets say the last 12 months, will allow you to start spotting trends. Is the post most popular over a US winter? Is it a recipe mainly cooked on weekends? Is it a consistent evergreen post? This in turn can help inform you when to post to socials or what posts might be related content.
- Monitoring – Your post may be a new or updated blog post that you’re checking in on 6 months after publishing (or republishing). Seeing the graph will tell you if it’s been a steady incline of views or if they’ve peppered off. It allows you to know whether you need to take action and make the post better with another update, or leave it alone because it’s picking up traffic naturally. It can help you pin point if you’ve lost traffic to a post that lines up with the date of Google Core Update.
4. Customise Your GA4 Mobile Dashboard
If you’re wanting to check your stats on the go, there is a way to easily create a custom dashboard on the Google Analytics app.
Like a lot of things in GA4, it’s up to you to set it up and customise it how you like.
Choose the reports you’d like to see, and add them in order of viewing preference. For example, we have two main reports on our dashboard at the moment, as we use the mobile app mainly to check things are tracking along okay on the site and not for deep analysis.
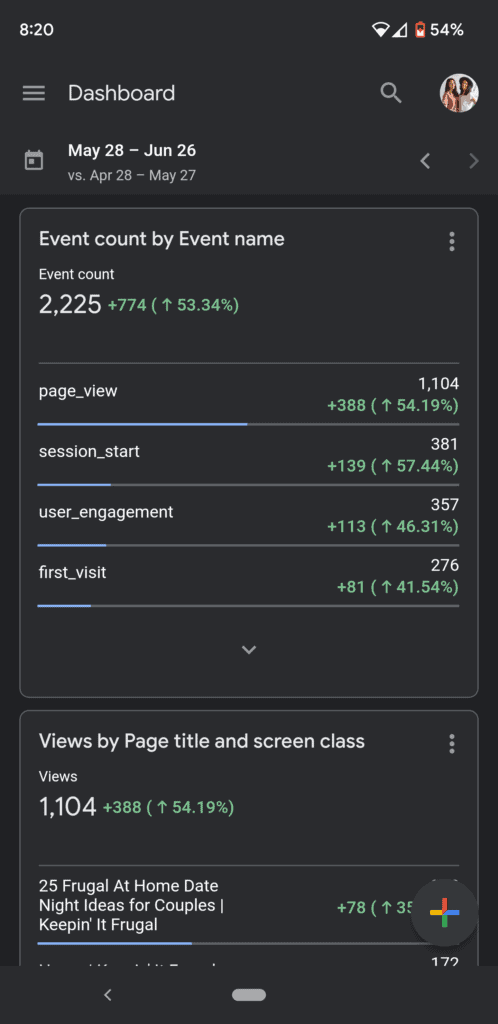
The two reports we’ll be adding in the example below is “Views by Page title and screen class” and “Event count by Event name”.
This will allow you to see the top pages currently viewed on the dates selected, and summary counts of all your Events in GA4 which include the numbers you know and love for page views, sessions and users.
How to add a report to your mobile GA4 dashboard:
First, head to the report you want to add.
For example, hit the hamburger drop down menu and go to:
Reports – Life cycle – Engagement
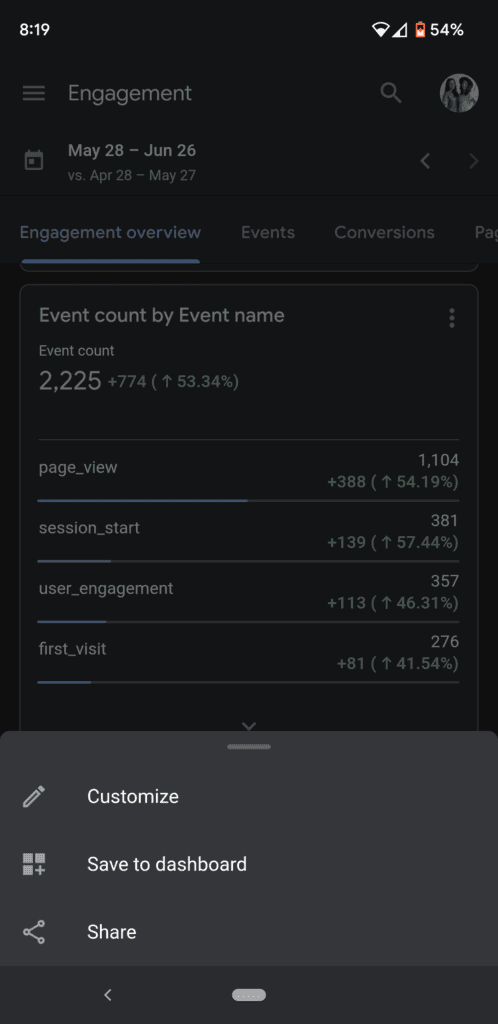
You’ll be on the engagement overview. Scroll down to the “Views by Page title and screen class” and hit the three dots in the top right hand corner of the report.
Click Save to dashboard.
Done! You’ve added your first report to your mobile dashboard.
If you also want to add the Events report, head back to Reports – Life cycle – Engagement, then scroll down to “Event count by Event name” and hit the three dots in the top right hand corner of the report again and select Save to dashboard. This will add the report below the first report you added.
Depending on your site, you may like to add more reports if there are any specific things you like to check on the fly. This could be things like Active Users by Country if you want to see where your readers are from at a certain time of day.
Bonus: Another blog favourite for us is users (or sessions) by source / medium to check if you’re readers are coming from Google, Pinterest etc. To add this, head to Events – Life cycle – Acquisition and scroll to the report “New Users by” and hit the drop down and select “First user source / medium“. Then add the report to your dashboard.
By selecting “First User” in this case, it tells you where your readers first came from, not repeat readers. So it’s good for seeing where new traffic is flowing in from.
To access your dashboard on mobile, just select the main menu and Dashboard.
5. Custom Reports are Essential! (And for some reason called Explore in GA4)
If this is your only take away from this post – please learn to setup custom reports for your blog in GA4’s Explore.
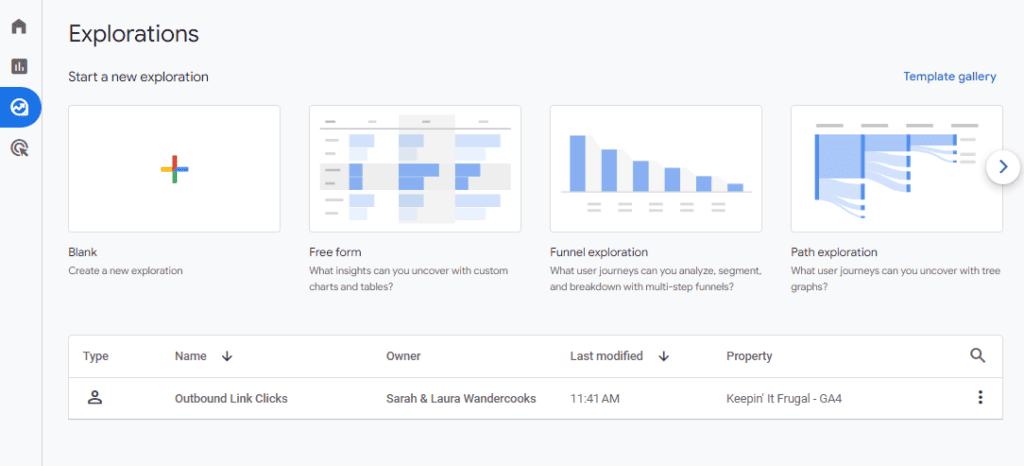
Known as Explorations, THIS is where the magic happens. It’s where you can really hone in on your data, setup your analytics they way you want to set it up AND where you can mimic a lot of the reports you loved most in Universal Analytics that are now gone.
Like we mentioned at the start – think of GA4 a little like IKEA. The Explore area is there for you to setup your own Exploration reports, but once they are setup, you can access and tweak them whenever you need.
We even use Explorations to recreate some of the existing reports you can already get in the GA4 Life cycle sections – why?
Thresholding.
Thresholding means on certain reports, if there is “a lack of user information or numbers” it won’t show. This means, we may only see 3 source results in GA4 vs 10+ in Universal Analytics. This can be especially frustrating on a new post – because say it has less than 50 views a month – GA4 acts as if the post doesn’t exist, and you can see any information! However, if you recreate the info in an Exploration report, it will (sometimes) show ALL the sources available, giving you a more complete picture to analyse.
To get you started, we’re giving away an excerpt from our book Unscramble Your Stats on our introduction to Explore. Get your free guide below on GA4 Explore so you can learn how to setup your very own first custom report. We’ve also included a little rundown on what Explore is and how it works in GA4.
A blank Exploration does look a little scary when you first open a blank report to setup, but we’ll take you through step-by-step so you understand where to input the correct information and you’ll be a GA4 master in no time!
We hope you learnt about a few new features today, and it’s made GA4 a little easier for you. Any questions, feel free to email us or comment below!
Learn more about food blogging here:


2 Comments
Kathy Marshall
13/02/2024 at 11:11 pmCan’t even find “lifecycle>engagement” once clicked on reports?
Wandercooks
14/02/2024 at 12:45 pmUnder Reports, it will be on the left hand side menu. You should see Reports Snapshot, Realtime, then Life cycle – and underneath that Acquisition and then finally Engagement. Click on that and you should see the report. Let us know how you go!